'boxplot' is perhaps thought of as another way of representing 'densityplot' or distribution of the data. Hence, it is useful for comparing data by groups or categories within the data.
It works well with large dataset, compared to scatter plots which struggles when there are too many data points to plot.
The graphic parameters used for boxplot() are similar to plot().
Example:
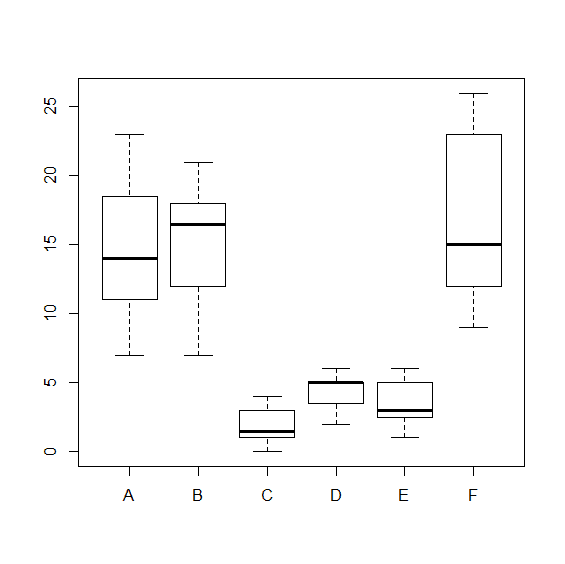
boxplot(count~spray,InsectSprays)

The above example show outliers. To remove these outliers from the graph, set 'outline' to FALSE.
boxplot(count~spray,InsectSprays,outline=FALSE)
'bwplot' is 'lattice' package's version of boxplot, and the graphic parameters used for boxplot() are similar to xyplot().
Example:
bwplot(uptake~Type,CO2)

To remove outliers, set do.out=FALSE.
bwplot(uptake~Type,CO2,do.out=FALSE)

With split panels,
bwplot(uptake~Treatment|Type,CO2)

To change colour of the median point
bwplot(uptake~Treatment|Type,CO2,col="red")

To change colour of the median point and rectangle frame,
bwplot(uptake~Treatment|Type,CO2,col="red",
par.settings=list(box.rectangle=list(col="salmon",alpha=0.4)))

To change colour of the median point, rectangle frame and rectangle body,
bwplot(uptake~Treatment|Type,CO2,col="red",
par.settings=list(box.rectangle=list(col="salmon",fill="salmon",alpha=0.4)))

To change colour of the median point, rectangle frame, rectangle body and umbrella,
bwplot(uptake~Treatment|Type,CO2,col="red",
par.settings=list(box.rectangle=list(col="salmon",fill="salmon",alpha=0.4),box.umbrella=list(col="salmon",alpha=0.4)))

To change colour of the median point, rectangle frame, rectangle body, umbrella and outlier,
bwplot(uptake~Treatment|Type,CO2,col="red",
par.settings=list(box.rectangle=list(col="salmon",fill="salmon",alpha=0.4),box.umbrella=list(col="salmon",alpha=0.4),plot.symbol=list(col="salmon",alpha=0.4)))

To overlap two bwplots for comparison,
bwplot(Sepal.Length~Species,iris,col="red",scale=list(y=list(lim=c(0,10))),key=list(space="top",column=2,text=list(label=c("Sepal Length","Petal Length"),cex=0.8,col="darkgrey"),
rectangles=list(col=c("salmon","dodgerblue"),rectangles=c("salmon","dodgerblue"),alpha=0.4,size=3)),
par.settings=list(box.rectangle=list(col="salmon",fill="salmon",alpha=0.4),box.umbrella=list(col="salmon",alpha=0.4),plot.symbol=list(col="salmon",alpha=0.4)))+
as.layer(bwplot(Petal.Length~Species,iris,col="blue",
par.settings=list(box.rectangle=list(col="dodgerblue",fill="dodgerblue",alpha=0.4),box.umbrella=list(col="dodgerblue",alpha=0.4),plot.symbol=list(col="dodgerblue",alpha=0.4)))
)
